Understanding: Townsend Deprivation Index (2011)#
Last modified: 06 Jan 2026
The Townsend Deprivation Index, first introduced by Peter Townsend in 1987, is a widely used measure of material deprivation. A Townsend score combines census variables to produce an overall deprivation score for geographical areas. The index is frequently applied in health, sociological and education research to examine if there are relationships between deprivation and outcomes. In the dataset available in the UK LLC TRE, Townsend scores for 2011 were calculated by the UK Data Service using data from the 2011 Census.
Methodology#
Detailed information on how the Townsend scores were calculated can be found in Yousaf and Bonsall’s report (2017) which can be downloaded here.
Yousaf and Bonsall (2017) selected the census variables which best measured each of the indicators of material deprivation defined by Townsend (Table 1).
Table 1 Townsend deprivation index indicators, definitions and census variables
Townsend Deprivation Index Indicator |
Definition |
Census Variable |
|---|---|---|
Unemployment |
Percentage of all people who are economically active who are unemployed. |
Economic Activity |
Overcrowding |
Percentage of households that are overcrowded, i.e. more occupants than there are rooms. |
Persons per room |
Non-car ownership |
Percentage of households that do not own a car or van. |
Car or van availability |
Non-home ownership |
Percentage of households that are not owner-occupied, i.e. rented or living rent free. |
Tenure |
The Townsend deprivation scores were calculated using the percentages of the 4 indicators: - Percentage non-car ownership: Households with no car/ Total of households x 100 - Percentage non- home ownership: Households that are not occupant owned (rented)/ Total of households x 100 - Percentage unemployment: People who are unemployed/ Total people economically active x 100
- Percentage overcrowding: Households that are overcrowded/ Total of households x 100
Calculation of the Townsend score#
The percentages of the 4 indicators were weighted equally in the calculation.
The unemployment and overcrowding indicators were log transformed to normalise the skewed results from these variables.
A standard Z score was then calculated from each of the indicators.
The overall Townsend score was created using the following calculation: Z score no car + Z score non homeowner + Z score unemployed + Z score overcrowd
Once the Townsend Deprivation Scores were calculated they were split into quintiles. One fifth of all the areas were allocated to one of the 5 quintiles equally. The first quintile represents the fifth of the country that was least deprived whilst the fifth quintile represents the most deprived.
Caveats:#
The quintiles in this dataset are based on area, meaning that one-fifth of all areas fall into each quintile.1
Yousaf and Bonsall’s (2017) report highlights that when using the Townsend Index for cities, no car and van availability was a significant contributor to deprivation within the local authorities. In the context of modern society and issues such as air pollution and advanced public transport links which were not present when the deprivation measure was introduced, it is important to consider the viability of the indicator to measure deprivation. Furthermore, the indicator has been criticised as car ownership in rural areas may be considered a vital requirement rather than an indicator of wealth (Martin et al., 2000)(The (mis)Representation of Rural Deprivation - David Martin, Philip Brigham, Paul Roderick, Sarah Barnett, Ian Diamond, 2000).
Yousaf and Bonsall (2017) argue that there are long-established indicators of deprivation that the Townsend deprivation index does not consider that other measures of deprivation do. For example, social class.
1Alternative approaches to splitting quintiles include, quintiles by population which takes into account that some areas have higher population than others. The latter method of producing quintiles is more accurate, although the results that are produced are similar and do not have an effect on the actual Townsend scores produced. Using the latter method will mean that some of the areas will be allocated to different quintiles with a different range of scores in each quintile.
Limitations:#
A specific variable that was deemed appropriate but was not suitable for use for the purposes of comparability was using the census variable ‘persons per bedroom’ as a measure for the indicator overcrowding. This was only available for England and Wales and was introduced in the most recent census. Future research could make use of this measure and determine which measure for overcrowding is deemed more appropriate (Yousaf and Bonsall, 2017).
The findings in Yousaf and Bonsall’s (2017) report illustrate that the Townsend score alone is useful in identifying levels of deprivation between different parts of the UK. However, when analysing levels of deprivation in terms of the different indicators that make up the Townsend score (the Z scores), a better indication as to why a particular area is deprived can be established.
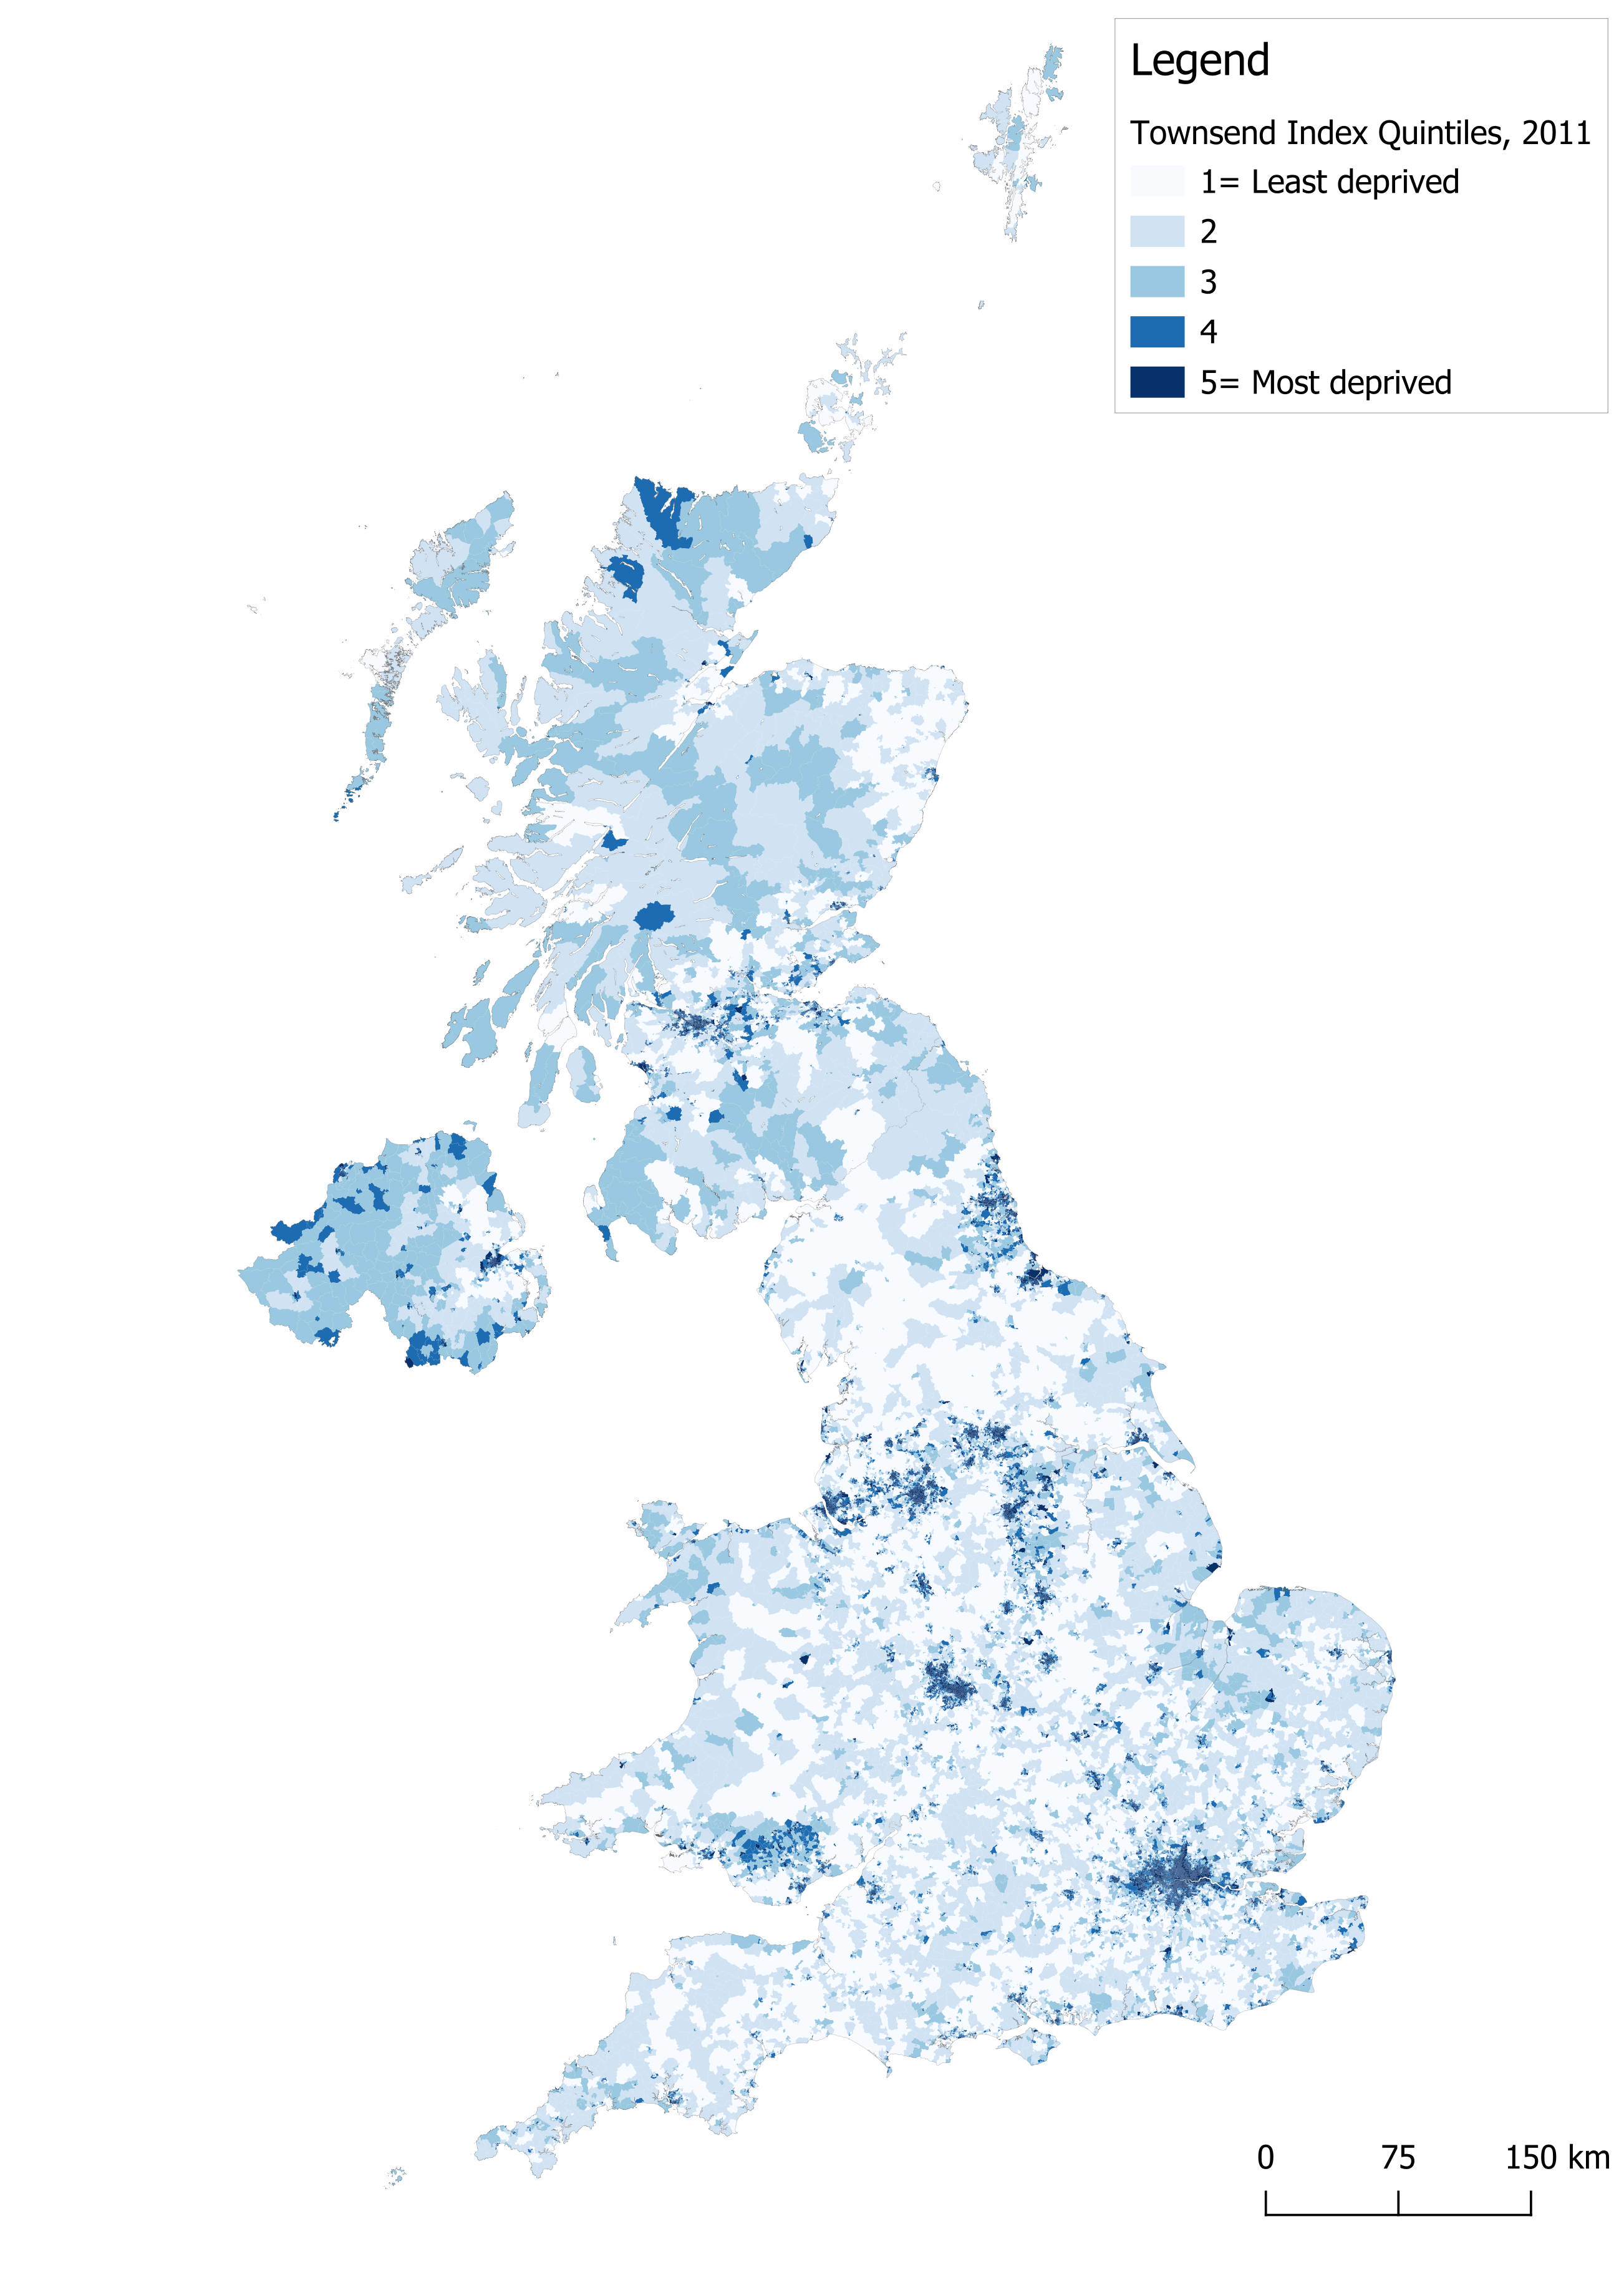
Townsend Index visualisation, 2011#
Figure 1 UK Townsend Deprivation scores from the 2011 census data, developed byYousaf and Bonsall (2017) displayed at Lower Super Output Area/Data Zone/ Super Output Area. Data source: Office for National Statistics; National Records of Scotland; Northern Ireland Statistics and Research Agency; UK Data Service.